
Understanding market trends and indicators is important for investors and traders who are looking to make informed decisions about buying and selling financial assets.In order to understand market trends and indicators, it is important to do your research and stay up to date on economic news and data. Additionally, it is important to have a solid understanding of technical analysis and the various indicators that are used to analyze market trends.
What Is Market Trend?
Stock prices may may day by day. It may be volatile we take the price for short term .But if we look at slightly long-term chart patterns, you can find out a clear market trend either up or down.
Market trend is the upward or downward movement of an asset over a period of time. Upward movement is called an uptrend, while those which move lower over a period of time are said to be in a downtrend. Investors have a tendency of buying stocks that are seemingly in an uptrend and selling the ones in a downtrend.
What are the three types of market trends?
Uptrend:
In an uptrend, both the peaks (tops) and troughs (bottoms) of a stock chart keep increasing successively. So, every day or so, the stock price touches a new high and falls lower than it did previous weeks or months. This steady rise in tops and bottoms indicates that the market has a positive sentiment. It expects the stock has a higher chance to appreciate more than depreciate. So, more investors buy, thus driving the price higher.
Downtrend:
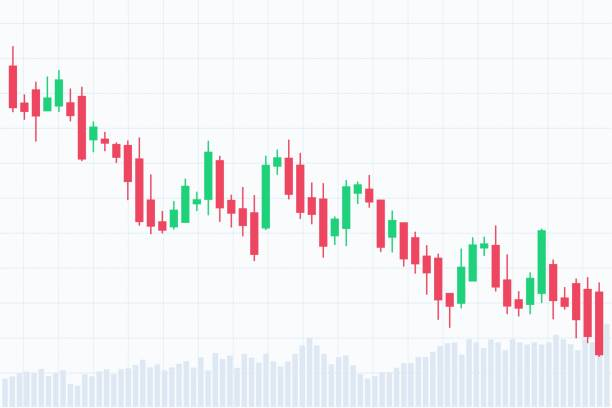
A downtrend is a pattern, where a stock is falling constantly. Not only are successive peaks lower, successive troughs are also lower. This means that investors in the market are convinced that the stock will fall further. Each little rise in the stock’s price is used by investors to sell their existing quota of shares. No further buying takes place at these levels.
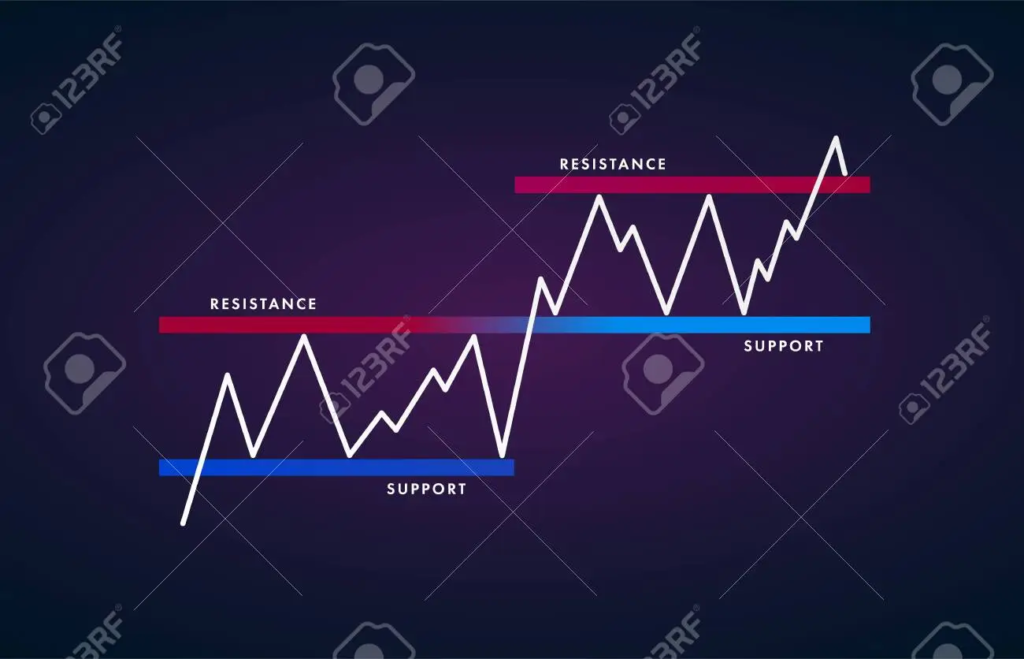
Sideways/ Horizontal Trends:
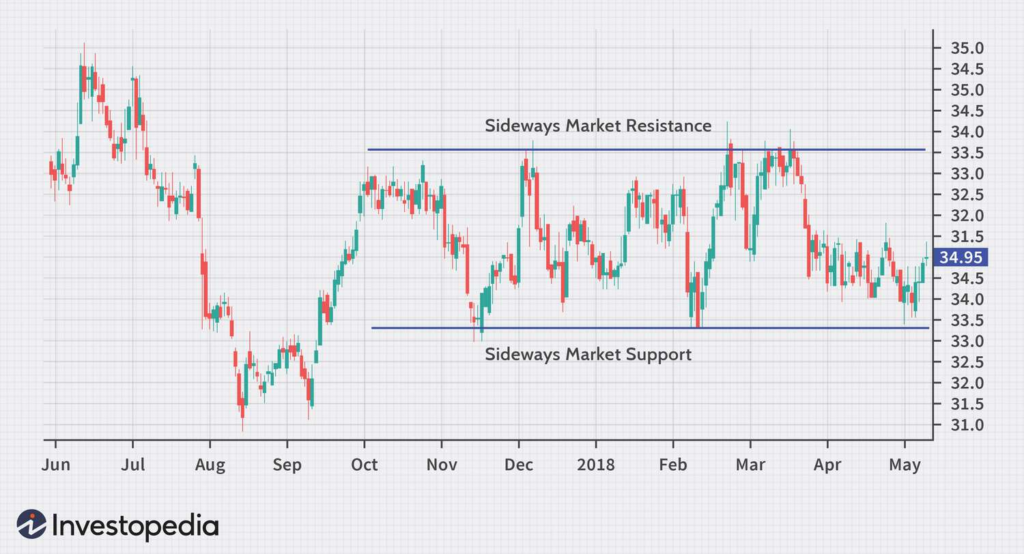
In a sideways trend, means the price of a stock or security stays within a given range (between the support and resistance) for a long period of time, Sideways markets are typically volatile and indecisive. This trend occurs when the forces of supply and demand are nearly equal.
Why Should You Understand Market Trends?
Understanding market trends and indicators is crucial for investors who want to make informed investment decisions in the stock market. It tells you which stocks are expected to move up, and how much risk there is along the way. If you sell before the price hits its peak, you may lose out on good profits. Similarly, if you buy before the price falls to its lowest point, then you may make less profit when you finally sell it.
e
What are the factors affecting market trends?
- Government policy
The fiscal and monetary policies of government their central banks have a significant impact on the financial sector .Governments can control the amount of investment that comes into and leaves the nation by changing interest rates, tax rates, and the amount of money available on the open market.
- Market sentiments
Market sentiment refers to the overall mood or attitude of investors toward the market. Positive market sentiment can lead to a bullish market, while negative sentiment can lead to a bearish market.
- Supply and demand
The asset price moves upwards and downwards depending upon the supply and demand for goods, services, currencies, and other investments. Prices will increase if there is a demand for something and a diminishing supply. Prices will decrease if supply rises more than the existing demand.to fluctuate following shifts in dynamics between supply and demand This is especially relevant for commodities.
- Corporate and economics news
A stellar quarterly result of a company that beats market expectation can lead to a sudden uptrend. However a negative news can seriously impact the market, leading to a downtrend.
What are market indicators?
Stock market indicators are essentially quantitative tools used by traders and investors to interpret financial data. The market indicators use data from a group of related stocks, rather than just a single stock . This in turn helps them determine their entry and exit points of a trade. Market indicators comprise of formulas and ratios. There are a variety of stock market indicators available ,but the 4 major stock market indicators are
- Market breadth
Market breadth analyses the number of stocks advancing as compared to those that are declining in a given index. There are various market breadth indicators such as the advance/decline ratio. Advance/decline indicators measure the number of stocks advancing and declining for the day When more stocks are advancing than declining, it suggests bullish market sentiment and vice versa.
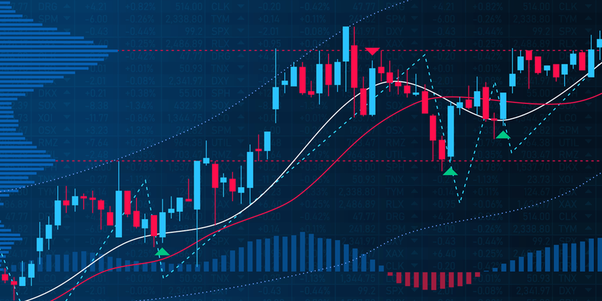
- Moving Averages
Moving averages are a common technical indicator that tracks the average price of a stock over a certain period of time. This can help investors identify trends and potential support and resistance levels.They are calculated by taking the average price of a stock over a certain period of time (e.g.,20 days, 50 days or 200 days) and plotting it on a chart. Traders use moving averages to identify buy and sell signals and to determine the overall direction of the market.
- Relative Strength Index (RSI)
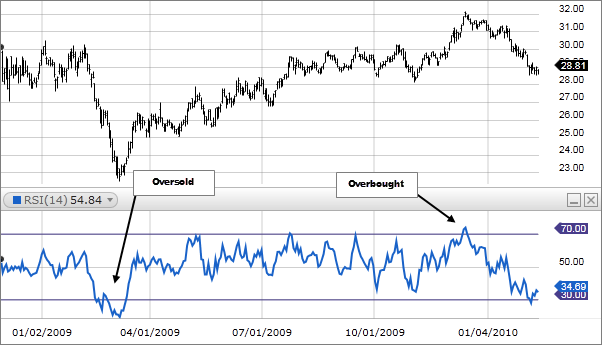
The RSI is a momentum oscillator that measures the strength of a stock’s price action over a given period of time. It ranges from 0 to 100 and is typically plotted on a chart below the stock price. A reading above 70 may indicate that a stock is overbought and due for a correction, while a reading below 30 may indicate that a stock is oversold and due for a rebound.
- On Balance Volume(OBV)
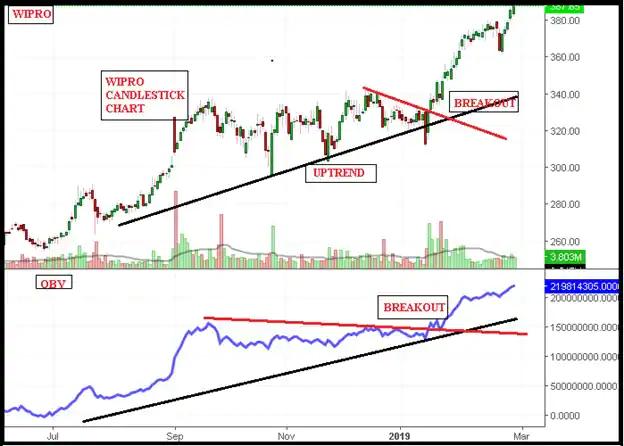
The volume of trade is an important stock market indicator. Volume measures the number of shares of a stock that are traded over a given period of time. High volume may indicate that there is a lot of buying or selling interest happening in a particular stock, which can be a sign of market momentum. As a Stock market indicator, you can look at OBV being for volumes as moving averages are to stock prices. OBV, does not predict price movements but merely confirms the underlying trends. A rising OBV with a rising moving average line shows bullishness. Similarly, rising OBV with a falling moving average line shows bearishness.
What are the importance of stock market indicators?
The price of stocks varies in each seconds. So traders have to analyse the market movement correctly. The indicators are used to form different patterns based on historical data so that the entry and exit points can be decided in any trade. By the exact analysis of any indicator it is possible to attain maximum profit and minimize the lose.
Conclusion
Understanding the above discuss market trends and indicators can help investors make informed decisions when buying and selling stocks. However, it’s important to remember that no single indicator can predict the future performance of the stock market correctly. Investors should use a variety of tools and strategies to build a diversified portfolio that aligns with their investment goals and risk tolerance.
http://recallsharp.ru/bitrix/redirect.php?goto=https://angel-numerology.ru
https://socialsocial.social/source/angel-numerology.ru
http://lyssymussu.ru/bitrix/redirect.php?event1=&event2=&event3=&goto=https://angel-numerology.ru
http://pikmlm.ru/out.php?p=http://angel-numerology.ru
https://dkpodmoskovie.ru/redirect?url=https://angel-numerology.ru
http://www.dollardollar.com